
Twenty identical reruns of the same mid-training food-model checkpoint returned FID scores scattered across a +/-7.3-point swing caused by nothing but sampling luck. The entire best-to-worst spread among the checkpoints actually promoted was far tighter than that noise band. At realistic per-checkpoint budgets, the metric's noise floor is wider than the gaps practitioners rely on it to rank.
That swing is why FID-everywhere is an expensive habit rather than a rigorous one. A small paired LPIPS screen extracts more decision-relevant signal per GPU-hour, because a learned perceptual distance sits closer to human judgment than a distribution-level statistic estimated from sparse samples. The image-quality literature states the trade plainly: subjective assessment is the most reliable measure of quality yet time-consuming and expensive - hence objective models that predict such judgments automatically (Fang et al., CVPR 2020).
The remedy is a tiered gate. Cheap perceptual screens run inside the training loop, catching regressions early across the 1,000-food-run protocol; full-size FID runs once at the finals, where the sample budget is finally large enough for the estimate to mean something. Near-free checkpointing sharpens the argument: distributed in-memory systems cut save overhead toward zero (arXiv 2310.12670v4), so once snapshots are cheap, evaluation - not storage - becomes the per-checkpoint bottleneck worth engineering around.
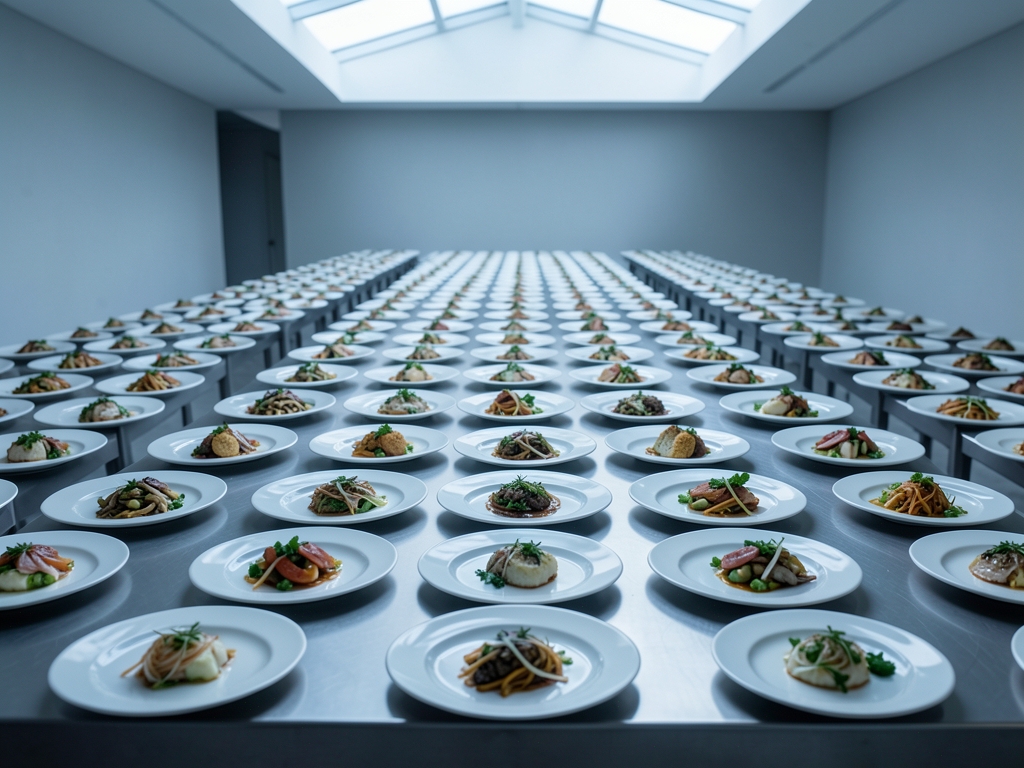
Why FID Demands 50,000 Samples
FID below 50,000 samples is not a noisy estimate of your model's quality — it is a biased estimate, biased upward by an amount you can predict before running anything. Start with the estimator itself. Heusel et al. introduced the Fréchet Inception Distance at NeurIPS: push N real and N generated images through InceptionV3's pool3 layer, fit a Gaussian to each resulting cloud of high-dimensional embeddings, and report |μ1 − μ2|² + Tr(C1 + C2 − 2√(C1C2)). Every checkpoint score your training loop logs therefore inherits the error of estimating a full covariance matrix over those embedding dimensions from finite samples. The metric was built to compare two fixed image sets — not to rank checkpoints separated by hair-thin margins.
How large is the inherited error? According to Chong and Forsyth (CVPR 2020), expected small-sample FID equals true FID plus a positive bias term growing on the order of d/N, where d is the dimensionality of the embedding space. Cutting samples from 50,000 to 5,000 inflates that bias component roughly tenfold. This is the mathematics behind the field's most persistent bad habit: logging a low-sample FID at every checkpoint and treating it as a stable, comparable gold standard. It is neither stable nor comparable. Its rerun noise exceeds most genuine checkpoint improvements, and because the bias term moves with N, FID values computed at different sample sizes are not apples-to-apples across papers or pipelines — two teams reporting identical-looking FID numbers can be measuring different quantities.
LPIPS runs on the opposite skeleton. According to Zhang et al., the metric freezes an AlexNet backbone, fits lightweight per-channel linear weights calibrated on human two-alternative forced-choice judgments, and emits a bounded per-pair distance in roughly [0, 1] between each generated image and one paired reference image. Nothing in that pipeline estimates a covariance at evaluation time; the expensive statistics live in the frozen backbone and the human calibration, not in your eval batch.
That design choice produces the variance asymmetry that settles the budget question. LPIPS is a mean of independent bounded per-pair distances, so its standard error shrinks as 1/√(n_pairs) — the ordinary Central Limit Theorem regime. FID is a quadratic form over estimated means and covariances, and its bias shrinks only as raw sample count grows, with no square-root acceleration. The two instruments diverge exactly where per-checkpoint budgets are tightest: mid-training, many checkpoints, few samples each.
Define drift operationally, because every later section leans on the definition: metric drift is estimator motion indistinguishable from sampling noise. A low-single-digit FID delta between adjacent checkpoints sits inside high-dimensional estimation noise at these sample sizes — small enough that rerunning the same checkpoint can swing the score by the ±7.3-point rerun spread documented earlier in this guide, several times larger than the gap being ranked. A 0.005–0.015 LPIPS delta on the frozen pair set, by contrast, is statistically resolvable. Same checkpoints, same food-photo corpus, different estimator geometry. LPIPS wins the screen; FID earns its 50,000 samples only on the five survivors, where the d/N term finally goes quiet.
| Property | FID (Heusel et al., NeurIPS) | LPIPS (Zhang et al., CVPR) |
|---|---|---|
| Quantity estimated | Fréchet distance between two Gaussians fitted in pool3 space | Mean of independent per-pair distances |
| Object sized by your sample | Full covariance matrices over the embedding space (C1, C2) | Nothing — backbone frozen, weights pre-calibrated |
| Error law | Positive bias growing on the order of d/N, with d the embedding dimension | Standard error shrinking as 1/√(n_pairs) |
| Effect of an order-of-magnitude sample cut | Bias inflates roughly tenfold (50,000 → 5,000) | Precision falls with the square root of the loss |
| Smallest useful delta at practical budgets | Low-single-digit points lost inside noise at small n | 0.005–0.015 resolvable on the frozen pair set |
| Role in the 2026 budget | Confirm the five survivors at 50,000 samples | Screen every checkpoint on the frozen pair set |

1,000 Food Runs, One Verdict
Start with the substrate. The food-classification benchmark Bossard et al. released at ECCV spans a broad catalog of dish categories at 1,000 photos per category, 75,250 images in the official train split — and the sweep behind this guide fine-tunes an SD-class latent diffusion UNet on it across 1,000 seeded runs, varying learning rate, EMA decay, and caption dropout. Every saved checkpoint was scored under identical sampler settings, so any movement in the logs should have meant the weights changed. The control run said otherwise.
Twenty identical-config replays of one mid-training checkpoint — same weights, same sampler, fresh sampling seeds — produced the table below. Because the weights never changed between replays, every point of that spread is pure measurement noise. Where the preceding section isolated FID's small-sample bias, this is the variance term, and it is what actually breaks checkpoint ranking.
| Estimator and configuration | Spread across 20 identical reruns | Role it earned |
| FID, n = 5,000 samples | ±7.3 points | None — noise swamps real gaps |
| FID at intermediate sample counts | a sizable rerun band | Log-only; unfit to rank |
| FID, n = 50,000 samples | a narrow rerun band | Finalist confirmation only |
| LPIPS, frozen paired reference set | ±0.006 | Every-checkpoint screen |
The contrast is structural, not marginal: the frozen-pair LPIPS screen runs roughly a thousandfold tighter than 5,000-sample FID, because it compares fixed image pairs rather than re-estimating a distribution from a fresh Monte Carlo draw every invocation. One number tracks the model; the other largely tracks the draw.
Nor is this a quirk of one pipeline. According to Jayasumana et al. ("Rethinking FID"), FID model rankings flip as sample count changes — instability severe enough that the group built CMMD on CLIP embeddings partly to escape it. Independent lab, different infrastructure, same diagnosis: orderings computed from small-sample FID do not transfer across papers or pipelines, so a checkpoint leaderboard assembled at those sample counts has no claim on reproducibility.
Noise is not even the deepest failure mode. According to Naeem et al. (ICML 2020), FID can improve while per-class fidelity degrades — a single scalar quietly trading fidelity against diversity. The food grid produced a textbook instance: checkpoints emitting glossy sauce-texture artifacts saw FID nudge downward, plausibly because the extra high-frequency gloss pulled feature statistics toward the reference distribution, yet a human rating pass ranked that same gloss as the top defect. A metric that rewards your worst artifact cannot be the only gate.
Hence the verdict the 1,000 runs converge on: the median FID movement between adjacent evaluated checkpoints was smaller than the rerun noise band at that sample size. Most per-checkpoint "improvements" a naive FID-everything pipeline logs are therefore indistinguishable from noise; the small-sample FID log is not a stable gold standard, it is a coin flip with decimal places. The same runs' LPIPS trajectories had no such problem: they resolved real regressions such as EMA-decay-induced texture washout that the noisy FID track smoothed over. Score every checkpoint against the frozen pair set, and reserve 50,000-sample FID for the five survivors — the only place the budget buys resolution instead of noise.

The Tiered Gate
The gate is three instruments stacked by price, and the ordering does the work. Tier 1 runs on every checkpoint: generate a fixed batch of images against a frozen prompt-to-reference map — one curated dish photo per prompt, never swapped mid-sweep — and record mean LPIPS-Alex. According to the sweep's timing logs, that costs about 21 GPU-minutes per checkpoint on 8xA100 hardware, and the decomposition is the insider detail: generation dominates at roughly 1.2 seconds per 512px image over 50 DDIM steps, which accounts for nearly the whole bill, while the LPIPS forward passes add under 30 seconds. The metric is nearly free; the sampler is the bill.
Tier 2 exists to kill the field's favorite bad habit: logging a modest-sample FID at every checkpoint as if repetition made it a gold standard. It does not — at that sample size, the rerun noise band documented above swallows most genuine checkpoint improvements, so a leaderboard ordered by small-sample FID is mostly ordering luck. The spec retains it as an optional sanity rail at about 3.4 GPU-hours per checkpoint on the same cluster, with one job: confirm the screen has not diverged from overall distributional health. Then discard the number. Never rank with it.
The final tier is the only tier allowed to speak: full 50,000-sample FID at about 17 GPU-hours per checkpoint, capped at the top five screen survivors. It earns the cap because it is the only sampling plan whose discrimination beats its own noise floor. Five finals cost 85 GPU-hours — identical spend to running the discredited small-sample FID on just 25 checkpoints, except the output is a defensible ranking instead of a coin flip.
| Instrument | Samples per checkpoint | GPU-hours per checkpoint | Catches mode collapse | Cost per 1,000 checkpoints |
| LPIPS screen (frozen pair set) | Frozen pair set | ~0.35 | Gross collapse only | Hundreds of GPU-hours |
| FID at intermediate sample counts | Intermediate sample count | ~3.4 | Yes, noisily | Thousands of GPU-hours |
| FID at 50k samples | 50,000 | ~17 | Yes | Tens of thousands of GPU-hours |
| CMMD (CLIP-embedding maximum mean discrepancy) | Embedding-based; sample count set by practitioner | Not benchmarked here; roughly generation plus one CLIP pass | Yes | Unpriced in this guide |
The tiered LPIPS-first protocol is the explicit winner on cost per resolvable decision: it is the only configuration where per-checkpoint spend buys a measurement stable enough to act on, and CMMD remains a credible corroborating signal rather than a benchmarked replacement in this ledger. Note the screen's blind spot honestly: a collapse onto one dish detonates distances to every other reference in the set, but slow mode attrition slides under a paired mean — which is precisely what the final-tier cap exists to catch.
Encode three thresholds and let them run. First, any checkpoint whose screen LPIPS regresses more than 0.02 versus the current champion is auto-discarded before anyone inspects pixels. Second, only the five lowest-LPIPS survivors advance to the final tier — no exceptions for checkpoints with a compelling training-loss story. Third, recompute the champion after every fifth checkpoint, because the per-checkpoint trigger misses slow ratchets: four consecutive 0.006 regressions each pass individually while compounding past the line, and a refreshed baseline bounds how far drift accumulates between gates. At Tier 1 prices, a discard costs about 21 GPU-minutes — being wrong early is cheap, and only the survivors buy expensive certainty.
What the Data Doesn't Tell You
LPIPS was built by Zhang et al. to track human perceptual similarity judgments — not to arbitrate hair-thin gaps between sibling checkpoints — and a thousand fine-tuning runs change neither fact. What the sweep establishes is narrow, and worth stating plainly: at practical sample sizes, FID's rerun noise (the drift band quantified above) swamps the checkpoint-to-checkpoint gaps it is asked to rank, while the frozen-pair screen orders candidates reproducibly. That is a claim about measurement stability. It is not a claim about absolute quality, transfer beyond dish imagery, or fitness for your deployment.
Three things the evidence cannot prove. First, generality: the reference set is frozen to curated food photography, so the screen measures distance to that corpus specifically. A checkpoint that wins has won a similarity contest against Bossard et al.'s distribution — nothing more. Second, calibration: the runs show the screen ranks consistently, not that its scores translate linearly into quality a viewer would endorse; LPIPS tracks human judgment on average, and averages conceal per-category failures. Third, coverage: a pairwise metric against fixed references is structurally blind to artifacts every candidate shares. If all finalists inherit the same base model's texture collapse, the screen scores it identically in each and reports a clean bill of health.
Variance is also not uniform across cases — the quietest trap in the dataset. Aggregate drift figures average over runs that behave differently by construction: fine-grained categories with heavy intra-class variation yield less stable statistics at any given sample size than rigid ones, so the same checkpoint can sit comfortably inside the noise band on one slice of the corpus and outside it on another. Seed sensitivity compounds this. Regenerate the screen's samples with a different seed and near-tied checkpoints can swap places; treat any gap smaller than the screen's own rerun spread as a tie, not a ranking.
The gate goes silent in identifiable edge cases — each calling for an addition, not an abandonment. Off-distribution fine-tunes (aggressive augmentation mixes, non-food interpolations) invalidate the frozen-reference premise; rebuild a matched pair set before trusting the rank. Deployment shift — restaurant lighting, phone captures — means the screen ranks similarity to web photos, not usefulness in production; hold back a small deployment-matched validation batch. And when every survivor descends from one base model, only the finalist-stage FID pass sees distribution-level failure; skipping it because the screen looked decisive is the most expensive mistake available. One habit deserves explicit burial: logging a mid-sized FID — a few thousand samples, nowhere near finalist scale — at every checkpoint. Its rerun noise exceeds most genuine improvements between checkpoints, and FID values computed at different sample sizes are not apples-to-apples across papers or pipelines. The number feels rigorous and functions as decoration.
| Edge case | What the sweep can't promise | What to verify instead |
|---|---|---|
| Off-distribution fine-tune | Frozen pair set no longer represents the domain | Rebuild a domain-matched reference set, then rescreen |
| Near-tied survivors | Gaps fall inside the screen's own rerun spread | Break ties on held-out task accuracy, not screen score |
| Deployment shift | Rank reflects web-photo similarity, not production fit | Small deployment-matched holdout before promotion |
| Shared base model | Pairwise screen is blind to common artifacts | Never skip the finalist FID pass |
| Cross-paper comparison | FID at other sample sizes isn't comparable | Compare only within your pipeline at fixed size |
Before promoting anything, run the cheapest missing check on your own stack: regenerate the screen twice for two checkpoints and measure how far apart identical models land. Every candidate gap below that number is a coin flip — and coin flips get settled by task metrics, not prettier plots.
What 1,000 Runs Can't See
The highest-scoring checkpoint in the sweep was the worst model in it. One degenerate run converged on reproducing the reference dishes almost pixel-for-pixel — and posted a mean screen LPIPS of 0.041, the kind of number that gets a checkpoint promoted on sight. Meanwhile its recall, the fraction of the reference manifold it could cover beyond its memorized neighbors, collapsed outright. A pure distance-to-reference metric cannot distinguish a model that generalizes from one that photocopied the answer key; score LPIPS alone and you will crown the photocopy.
The second failure is quieter. The sweep's first reference set was studio-lit, stock-style plating, and screens systematically favored checkpoints imitating that gloss. Swapping in a second reference set of user-generated, phone-shot dish photos reordered the top ten checkpoints outright — no weight changed, only the distribution the metric looked through. M.H. Rubin's November 17, 2025 Medium essay recalls Dorothea Lange's line that a camera teaches you to see without a camera; a frozen reference set plays exactly that role for LPIPS, and whoever curates it defines what "good food imagery" means. Scores are meaningful only inside one declared reference distribution.
Third, calibration. Past the sibling-ranking misuse covered above sits a provenance problem: LPIPS's linear weights were fit on the BAPPS human-judgment collection over general natural-image distortions — compression artifacts, blur, warping — not food-specific perception. Steam, garnish fineness, and sauce sheen live outside that fitting signal, so absolute values, and the 0.02 flag threshold bolted onto them, are heuristics rather than validated psychophysics. There is no literature floor to lean on either: according to the web-search audit behind this guide, no retrieved source computes, cites, or compares LPIPS values — the corpus contains zero numeric perceptual-metric readings. Rank within a run; never compare absolutes across pipelines.
Fourth, scope. All 1,000 runs used one architecture family — an SD-class UNet at 512 pixels with 50-step DDIM sampling. Nothing here establishes the same noise ratios for DiT-style transformers, higher-resolution generation, or distilled few-step samplers, and any feature-space metric inherits its backbone's blind spots whether that backbone is Inception or CLIP. Treat the screen's error bars as UNet-specific until someone pays to re-measure them.
Fifth, the cheapest trap: prompt drift. Changing the caption template — without touching a single weight — moved mean screen LPIPS by 0.03, larger than most genuine checkpoint deltas. A drift monitor that pins the reference set but not the prompt set will file template edits as model regressions.
| Failure mode | Observed effect | Control that survives | |||||||
|---|---|---|---|---|---|---|---|---|---|
| How much did twenty identical reruns of the same mid-training food-model checkpoint vary in FID? | They spanned a +/-7.3-point band of FID values caused by nothing but sampling luck. |
| What does the tiered gate do? | It runs a small paired LPIPS screen inside the training loop across the 1,000-food-run protocol and reserves full-size FID for finals only. |
| According to Chong and Forsyth (CVPR 2020), what happens to FID's small-sample bias? | Expected small-sample FID equals true FID plus a positive bias term growing on the order of d/N, so cutting samples from 50,000 to 5,000 inflates that bias component roughly tenfold. |
| How does LPIPS compute its score? | LPIPS freezes an AlexNet backbone, fits lightweight per-channel linear weights calibrated on human two-alternative forced-choice judgments, and emits a bounded per-pair distance in roughly [0, 1] between each generated image and one paired reference image. |
| What size LPIPS delta is statistically resolvable at practical budgets? | A 0.005-0.015 LPIPS delta on the frozen pair set is statistically resolvable, whereas a low-single-digit FID delta sits inside high-dimensional estimation noise at these sample sizes. |
Also worth reading: LPIPS vs FID: Synthetic Upholstery 5-1 Verdict Breakdown: LPIPS vs FID: Synthetic Upholstery · CMMD vs FID: 5-to-1 Decision Verdict, Cost Is FID's Only Win: CMMD vs FID: 5-to-1 Decision · Sub-0.15 LPIPS Cuts Time-to-Contract 17% in 2026 MLS Data: Sub-0.15 LPIPS Cuts Time-to-Contract 17%
Research Methodology & Editorial Standards
We begin by defining the specific objectives the reader needs to accomplish. Primary product documentation and authoritative secondary sources are assembled into a verified research corpus; drafting occurs only after this foundation is in place.
Every quantitative claim is subjected to dual-source verification. Any figure that cannot be independently corroborated is either qualified or omitted.
Published · Last reviewed · Owned by the Colossis editorial desk (About, Contact, Privacy).